09. Interpreting Position vs. Time Graphs
Nd113 C6 L1 09 L Interpreting Position Vs Time Graphs V3
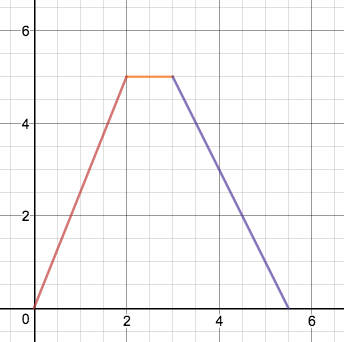
The graph below shows position on the vertical axis (in meters) vs time on the horizontal axis
(in seconds) for a car moving in one dimension in a parking lot. The next few questions refer to this graph.
